Training workshop on Bayesian population projections: theory and practiceCape Town, South Africa, 28-29 October 2017
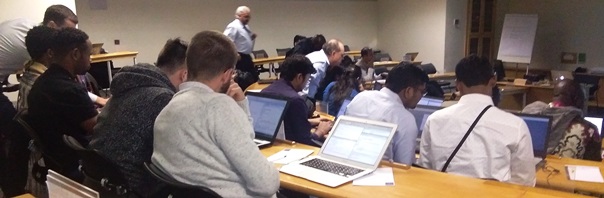
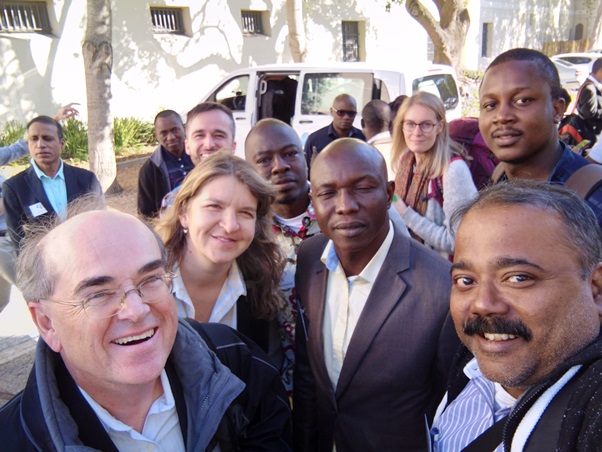
The training course on Bayesian population projections: theory and practice was held on 28-29 October 2017 at the University of Cape Town Graduate School of Business, and run by Adrian Raftery and Hana Ševčíková, from the University of Washington, who are leaders of the research group that developed the methods taught in the course, with the assistance of Mark Wheldon, from the United Nations, Population Division.
Population projections have until recently usually been done deterministically using the cohort component method, yielding a single value for each projected future population quantity of interest. Recently, the United Nation Population Division adopted a probabilistic approach to project fertility, mortality and population for all countries. In this approach, the total fertility rate and female and male life expectancy at birth are projected using Bayesian hierarchical models estimated via Markov Chain Monte Carlo. They are then combined with a cohort component model which yields probabilistic projection for any quantity of interest. The methodology is implemented in a suite of R packages which has been used by the UN analysts to produce the most recent revision of the World Population Prospects.
The meeting brought together 34 participants from 18 different countries, one third from Africa, one-third from South Asia, and the rest from Latin America, North America, Europe and other countries in Asia. Most participants were based at population research institutes or universities and a few worked for statistical offices. As a prerequiste, trainees were expected to be familiar with basic probability and statistics and to have a basic knowledge of the R programming language.
The course aimed to teach both the theory and practice behind the UN probabilistic projections, with explanations on Bayesian hierarchical modeling for the two main components, fertility and mortality. Hands-on exercises were given to trainees so that they could familiarize themselves with the functionalities of R packages and be able to understand the methods and generate projections using various output formats, such as graphs, tables, maps, and pyramids.
See also:
Funding: Financial support was provided by the William and Flora Hewlett Foundation to support demographers' participation in the Data Revolution. |
|